CTC 260 Projects
Project # 1 Develop IDF Curves (Teams of 2 or
Individual)
Using HYDRO-35 develop IDF curves (all
on one graph) for the SUNY Poly Campus:
Gather data for the following frequencies
and storm durations:
Storm
Frequencies: 2, 5, 10, 25, 50 and 100
years
Storm Durations: 5, 10, 15, 30, and
60 minutes
Using the NOAA Precipitation
Frequency Server (https://hdsc.nws.noaa.gov/pfds/
) get the data for the following frequencies and durations and place on an
excel file. Develop the 2nd
IDF graph for the following frequencies and storm durations:
Storm frequencies: 2, 5, 10,
25, 50 and 100 years
Storm Durations: 1, 2 ,3, 6, 12
and 24 hours
Write up a “mini” report
according to the following outline:
·
Cover
Sheet (title, date, name, manhours-number of hours worked on project)
·
Method
Using Hydro-35 (How did you develop or obtain the IDF curves using Hydro-35)
·
Sample
Calculations for Hydro-35
·
Graphs
of IDF Curves (two graphs; xy scatter (not line))—5
to 60 IDF curve (data from Hydro-35) and 1-24 hour IDF
curve (data from precipitation server)
·
Summary
(what did you learn, what areas you had problems with)
Drop off the report (electronic
format----PDF) in the Brightspace dropoff box.
Project # 2 Design a Storm System (Team
of 2 or Individual)
Download the project 2 excel
file. Compete the data and determine
the pipe sizes needed.
Just
drop off your final excel file in brightspace and do
not write up a report.
Note: Use Flowmaster to
check the pipe sizes.
Project # 3 Determine Peak Flows using
the Rational and TR-55 Methods (Team of 2 or Individual)
An old USGS metric is
here: Metric USGS Map (1:24,000 scale or 1”=2000 ft; contour internal = 6 meters). USGS map is here: Newer Map (English version)
Use
the rational and TR-55 methods to determine the peak flows (2, 5, 10, 25, 50 and 100 year frequencies) on the unnamed creek. The drainage area may be larger than what
should be used for the rational method; however, try the rational method anyway
for comparison and practice of using the method.
Instead of a formal report,
prepare a short summary which includes the following:
·
Your
Name and Date
·
Methods
used
·
Figure
showing watershed area
·
Table
of peak flows summarizing both methods
·
Discuss
the differences and possible sources for those differences
Resources:
Streamstats:
https://www.usgs.gov/streamstats
Web Soil Survey: https://websoilsurvey.nrcs.usda.gov/app/
Precipitation Server: https://hdsc.nws.noaa.gov/pfds/
Soil information---SUNY Poly Campus (not
applicable to the culvert above but just FYI--------)
A 3-ring binder is kept
by facilities showing boring data for each building and other projects done on campus.
There is data on about 100 or so borings.
Most terminate at 10 to 35 feet deep.
Some borings show a mixture of silt, sand, with
small amounts of gravel down to 25 feet.
At that depth, we typically encounter some
decomposed shale, glacial till, or an occasional boulder, but usually not
bedrock.
Depth to groundwater varies significantly
around the campus.
Up around the baseball field, I see readings as
shallow as 2 feet on April of 1984.
Generally I would say GW is 15 to 20 feet for many locations.
Final
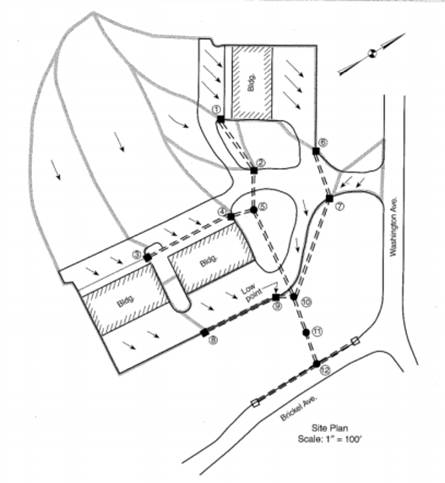
Exam Project # 4 Design a Detention Basin (Team of 2 or Individual)
The location map is provided on
Brightspace.
General steps:
1.
Calculate
peak flow of non-developed tract (Rational Method)
2.
Calculate
peak flow of developed tract (Rational Method)
3.
Calculate
inflow hydrograph of developed tract (Asymmetrical Triangle) for purposes of
routing
4.
Determine
location of detention basin; provide a drawing showing the location on the
given base map.
5.
By
trial and error design a detention basin and outlet structure. (Hint: you can
get a rough initial storage volume using TR-55 Chapter 6)
6.
Route
the inflow hydrograph through the designed detention basin. The routed outflow hydrograph should have the
same peak flow (or lower) as the non-developed tract.
7.
Provide
an engineering design report on your results according to the following
outline:
Instead of a formal engineering design report include the following:
·
Your
Name and Date
·
Introduction
·
Description
of Existing Conditions (Provide Copy of Map)
·
Assumptions
and Methods used
·
Detention
Basin Design Description and Drawings (including Location on Map and Basin
Drawings-preferably using CAD)
·
Summary
Paragraph
·
Include
other information:
·
Delineation
of drainage area(s)
·
IDF
Curve you used (use NOAA Precipitation Frequency Server)
·
Calculations
(TR-55 Worksheet 3 for tc; Rational Method
Calculations)
·
Calculations
(Routing)
SUNY Poly Home | Baran's Classes | E-Mail S. J. Baran